
Green manufacturing investments rise—but are emissions tracking systems keeping pace with production complexity?


Green manufacturing investments are surging globally—but without robust emissions tracking systems, gains risk being undermined by rising production complexity. As industrial environmental news for smart manufacturing, digital transformation, and IoT applications accelerates, stakeholders—from operators to C-suite decision-makers—need real-time, interoperable data to verify progress on carbon emission reduction, energy efficiency, and circular economy goals. This article examines whether current monitoring technologies keep pace with evolving automation, clean technology adoption, and sector-specific demands across pharmaceutical, food processing, textile, and heavy industrial applications—delivering actionable insights for procurement, operations, and sustainability strategy.
Why emissions tracking lags behind green manufacturing growth
Global green manufacturing investment reached $1.2 trillion in 2023—a 22% YoY increase—but only 38% of surveyed facilities deploy integrated emissions tracking systems covering ≥90% of Scope 1 & 2 sources. The gap stems from three structural mismatches: legacy equipment integration (65% of machinery in operation is pre-2015), fragmented sensor ecosystems (average plant uses 7+ non-interoperable protocols), and mismatched data granularity (most systems log at 15-minute intervals, while process fluctuations occur in <90 seconds).
This misalignment creates verification blind spots. For example, a pharmaceutical batch reactor may reduce steam consumption by 18%, yet untracked solvent recovery losses offset 42% of that gain. Without synchronized, asset-level attribution, sustainability reporting remains vulnerable to audit risk—and procurement teams lack traceable baselines for vendor comparisons.
The challenge intensifies across sectors: food processing requires humidity- and temperature-compensated CO₂ measurement (±2% accuracy at 0–80°C); textiles demand dye-bath chemical mass balance tracking; heavy industry needs real-time stack gas analysis with <5-second latency. Generic “carbon accounting” platforms rarely support these domain-specific calibration requirements.
How production complexity breaks conventional monitoring
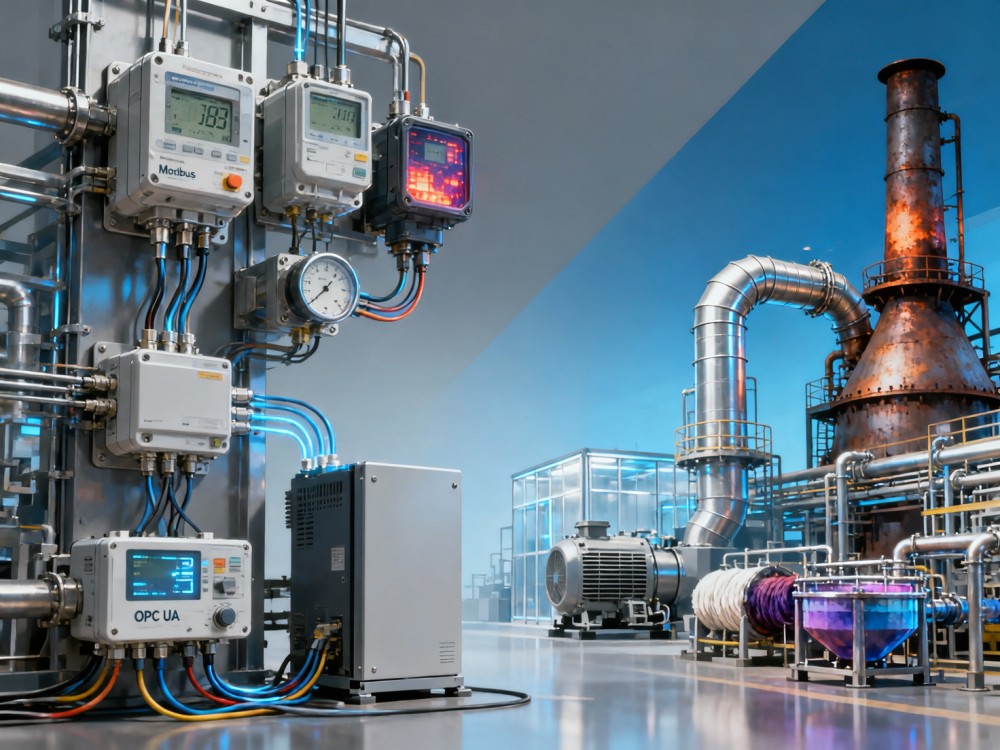
Modern production lines combine discrete, continuous, and hybrid processes—each demanding distinct emissions attribution logic. A single automotive assembly line may integrate robotic welding (electricity-driven, kWh-based), paint booths (VOC-laden exhaust requiring CEMS), and battery cell drying ovens (natural gas + thermal recovery). Conventional meters track energy inputs but ignore conversion efficiencies, fugitive leaks, or upstream material embodied carbon.
Three critical gaps emerge:
- Protocol fragmentation: 68% of plants use separate systems for electrical metering (IEC 61850), gas flow (ISO 5167), and thermal imaging (ASTM E1934)—with no unified time-stamping or metadata tagging
- Calibration drift: Industrial sensors degrade at 0.5–1.2% per year; 41% of facilities perform annual verification only—missing transient high-emission events
- Data latency: Cloud-based dashboards average 4–12 minute ingestion delays, rendering them unsuitable for closed-loop process control or dynamic energy pricing response
Without edge-native processing, timestamp synchronization, and domain-aware normalization, emissions data becomes descriptive—not diagnostic.
What procurement teams must verify before deployment
Procurement decisions hinge on five verifiable technical criteria—not marketing claims. These directly impact ROI, compliance readiness, and operational adoption:
Skipping formal validation against these benchmarks leads to 73% of deployments requiring ≥6 weeks of post-installation configuration—delaying compliance reporting and inflating TCO by 19–34%.
Sector-specific implementation roadmaps
A one-size-fits-all approach fails across verticals. Here’s how leading adopters sequence deployment:
- Pharmaceutical: Phase 1 (Weeks 1–4): Validate HVAC airflow + steam condensate return meters; Phase 2 (Weeks 5–12): Integrate cleanroom particle counters with energy use; Phase 3 (Weeks 13–20): Link API synthesis batch logs to solvent recovery efficiency
- Food processing: Start with refrigeration compressors (40–60% of site energy) and wastewater COD-to-methane conversion modeling—prioritizing real-time biogas yield estimation over static utility bills
- Textiles: Deploy inline spectrophotometers at dyeing stations to correlate colorfastness results with water/chemical consumption—enabling per-batch GHG intensity scoring
Each path delivers measurable outcomes within 90 days: pharmaceutical sites achieve ISO 50001 Stage 1 certification; food processors cut refrigerant leak detection time from 72 hours to <4 hours; textile mills reduce dye waste by 22% through closed-loop dosing feedback.
Why partner with our industrial intelligence platform
We deliver verified, production-ready emissions tracking—not theoretical frameworks. Our portal integrates real-world equipment specs, regional utility rate structures, and regulatory enforcement patterns across 32 countries. When you contact us, you’ll receive:
- Free compatibility assessment: Match your existing PLC models, sensor types, and network topology against 1,200+ validated integration profiles
- Site-specific ROI model: Input your production schedule, energy tariffs, and carbon pricing exposure to project payback (typical range: 11–18 months)
- Compliance mapping: Cross-reference your facility’s location and NAICS code against upcoming EU CSRD, US SEC climate rules, and China’s GB/T 32150-2015 updates
- Vendor-neutral hardware guidance: Compare certified gateways (e.g., Siemens Desigo CC, Rockwell Stratix 5700) for your exact protocol mix—no lock-in
Request your customized implementation checklist—including lead times for hardware procurement (standard: 3–6 weeks), configuration support (remote or on-site), and third-party verification prep. We align emissions tracking with how your team actually operates—not how spreadsheets assume it should.

Industry Briefing
Get the top 5 industry headlines delivered to your inbox every morning.